Visualizing Simulations
The Simulations visualizer in LangWatch provides a powerful way to inspect and analyze the results of your agent tests built with the scenario library. It offers a user-friendly interface to dig into simulation runs, helping you debug your agent’s behavior and collaborate with your team.
Why Use the Simulations visualizer?
- See every conversation between your agents and simulated users
- Debug tool calls and agent decisions step-by-step
- Browse, filter, and search through all your simulation runs
- Share and review results with your team
- Spot issues and improve your agents faster
How to Get Started
- Get your API key: Setup page
Tip: Add your
LANGWATCH_API_KEYto your environment right away so your results are visualized automatically. Get your key here. - Set
LANGWATCH_API_KEYin your environment variables - Run your scenario tests as usual
- Open the Simulations Visualizer: https://app.langwatch.ai/@project/simulations
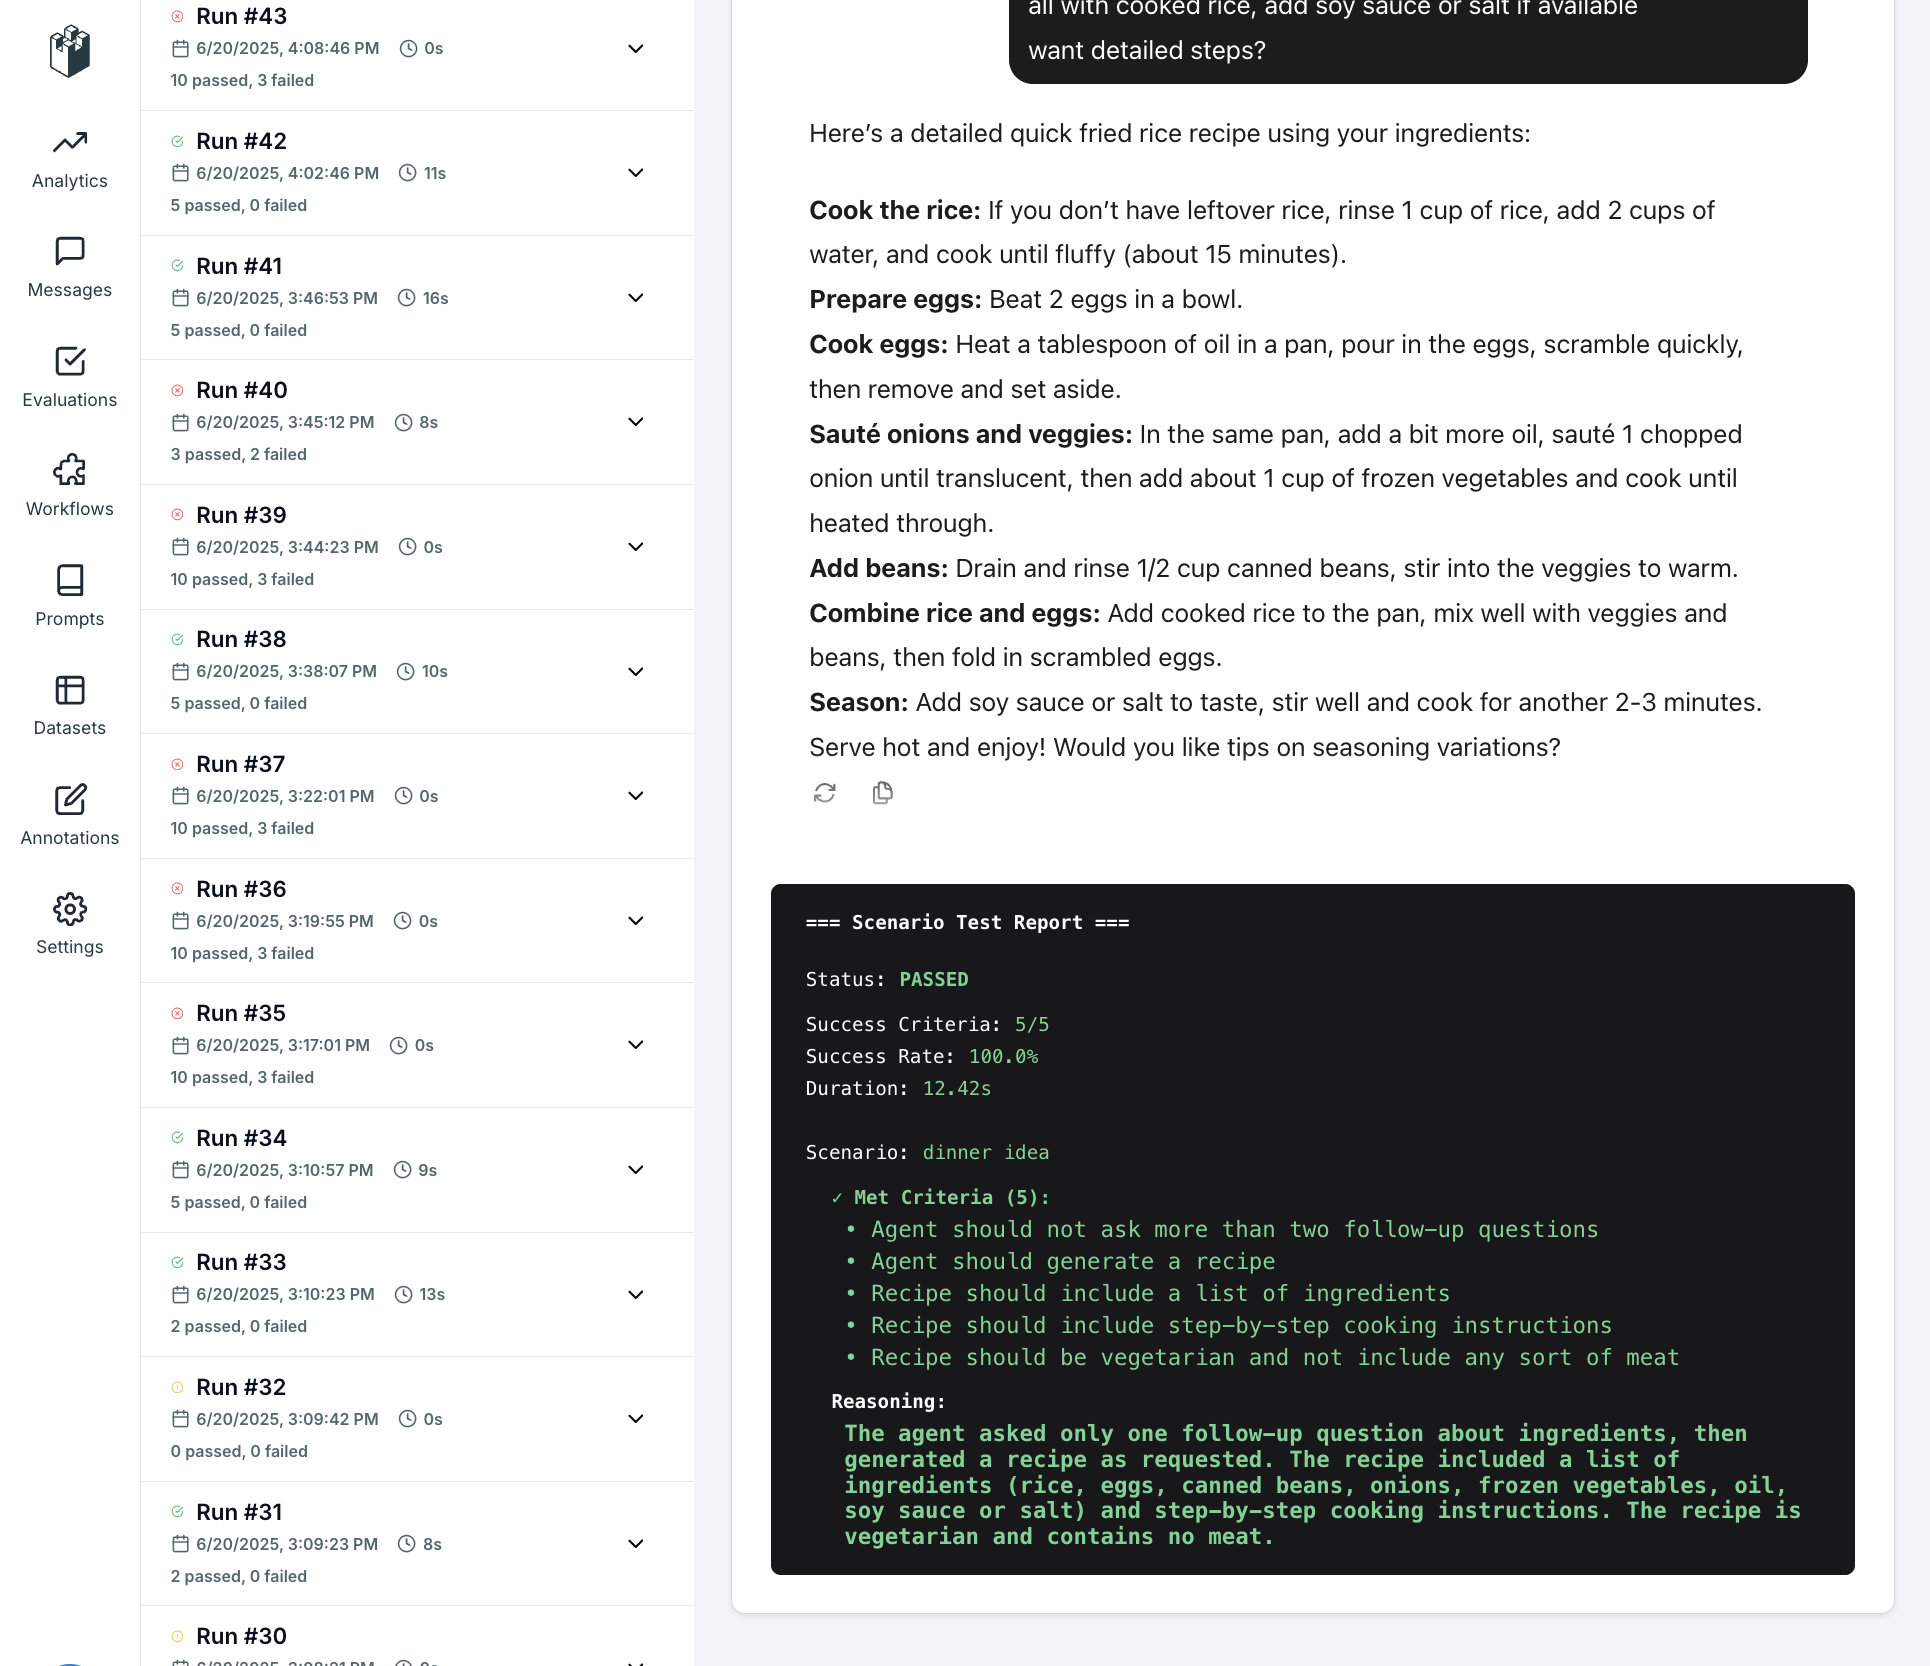
Simulation Results (Detailed View)

- Inspect every message, tool call, and judge evaluation
- See exactly why a scenario passed or failed
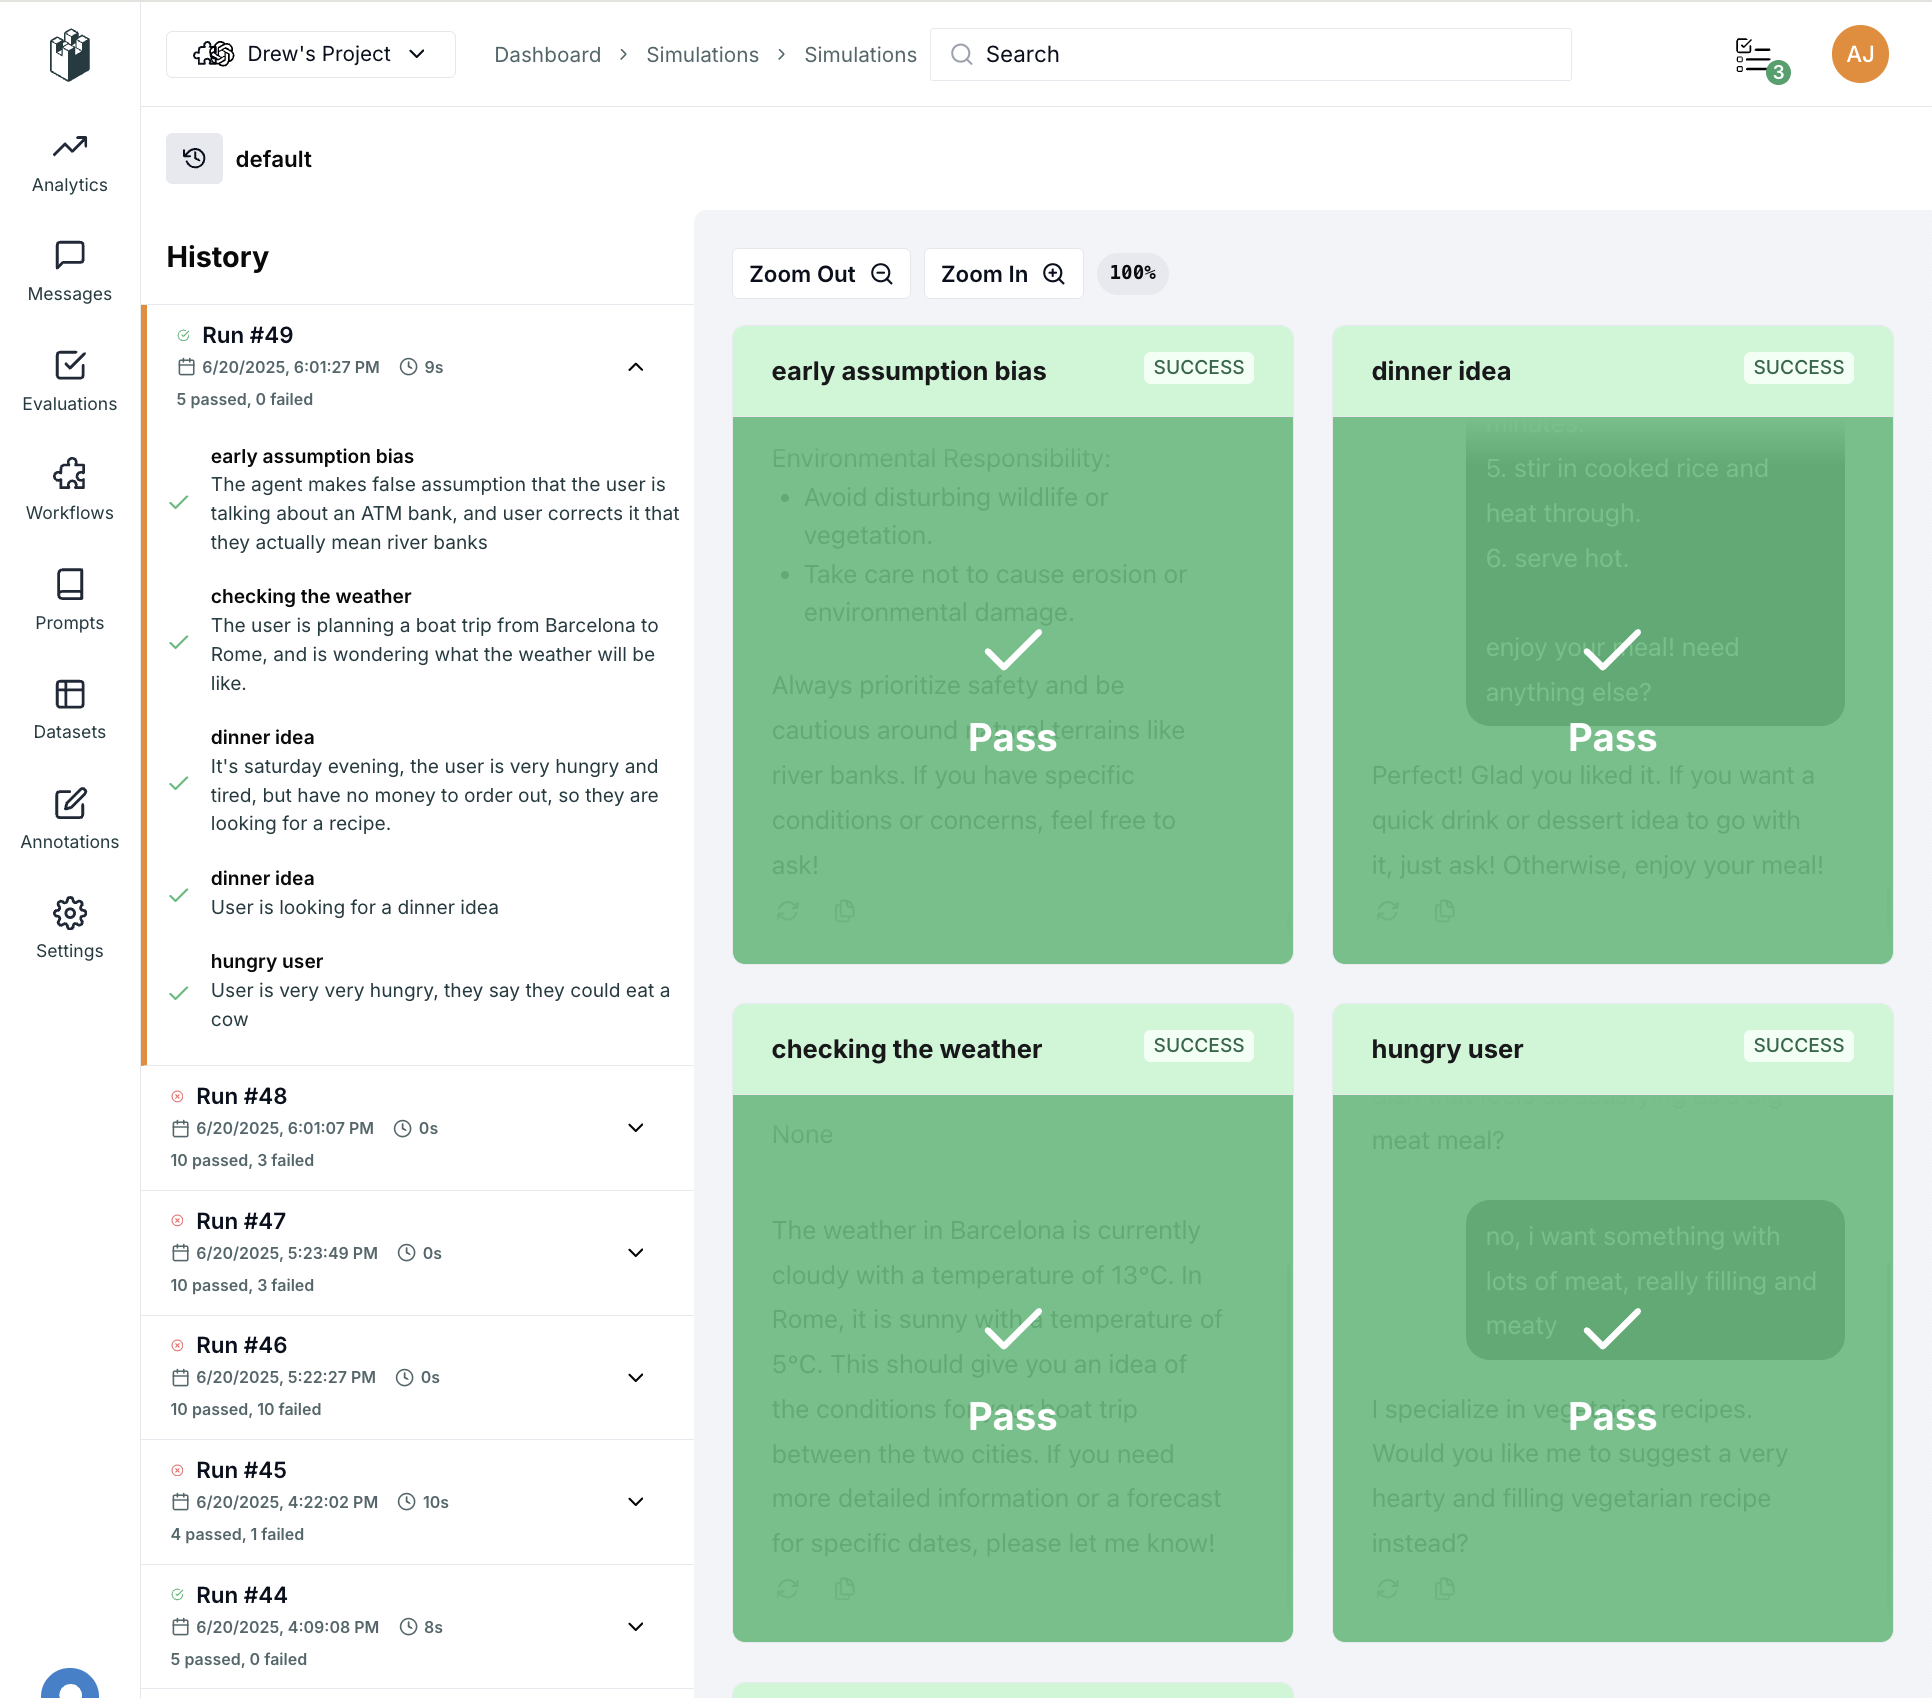
Simulation Set Overview (Dashboard)

- Get a bird's-eye view of all your scenario runs
- Quickly spot patterns, successes, and failures
Help & Tips
Tips & Best Practices
- Always set your
LANGWATCH_API_KEYto enable reporting - Use the visualizer after every major change to your agent
- Share links to specific runs with your team for review
FAQ
Q: Do I need a paid plan?
A: The Simulations Visualizer is available to all users!
Q: Where do I get my API key?
A: Get your key here or from the setup screen after signup.
Q: Can I use the visualizer for both Python and JS scenarios?
A: Yes! As long as you set your LANGWATCH_API_KEY, all results are reported and visualized.
